Cell Culture Monitoring with an Incubator Microscope
Monitor up to 24 cell cultures simultaneously with the zenCELL owl – automated brightfield imaging and analysis, continuously and in real time.
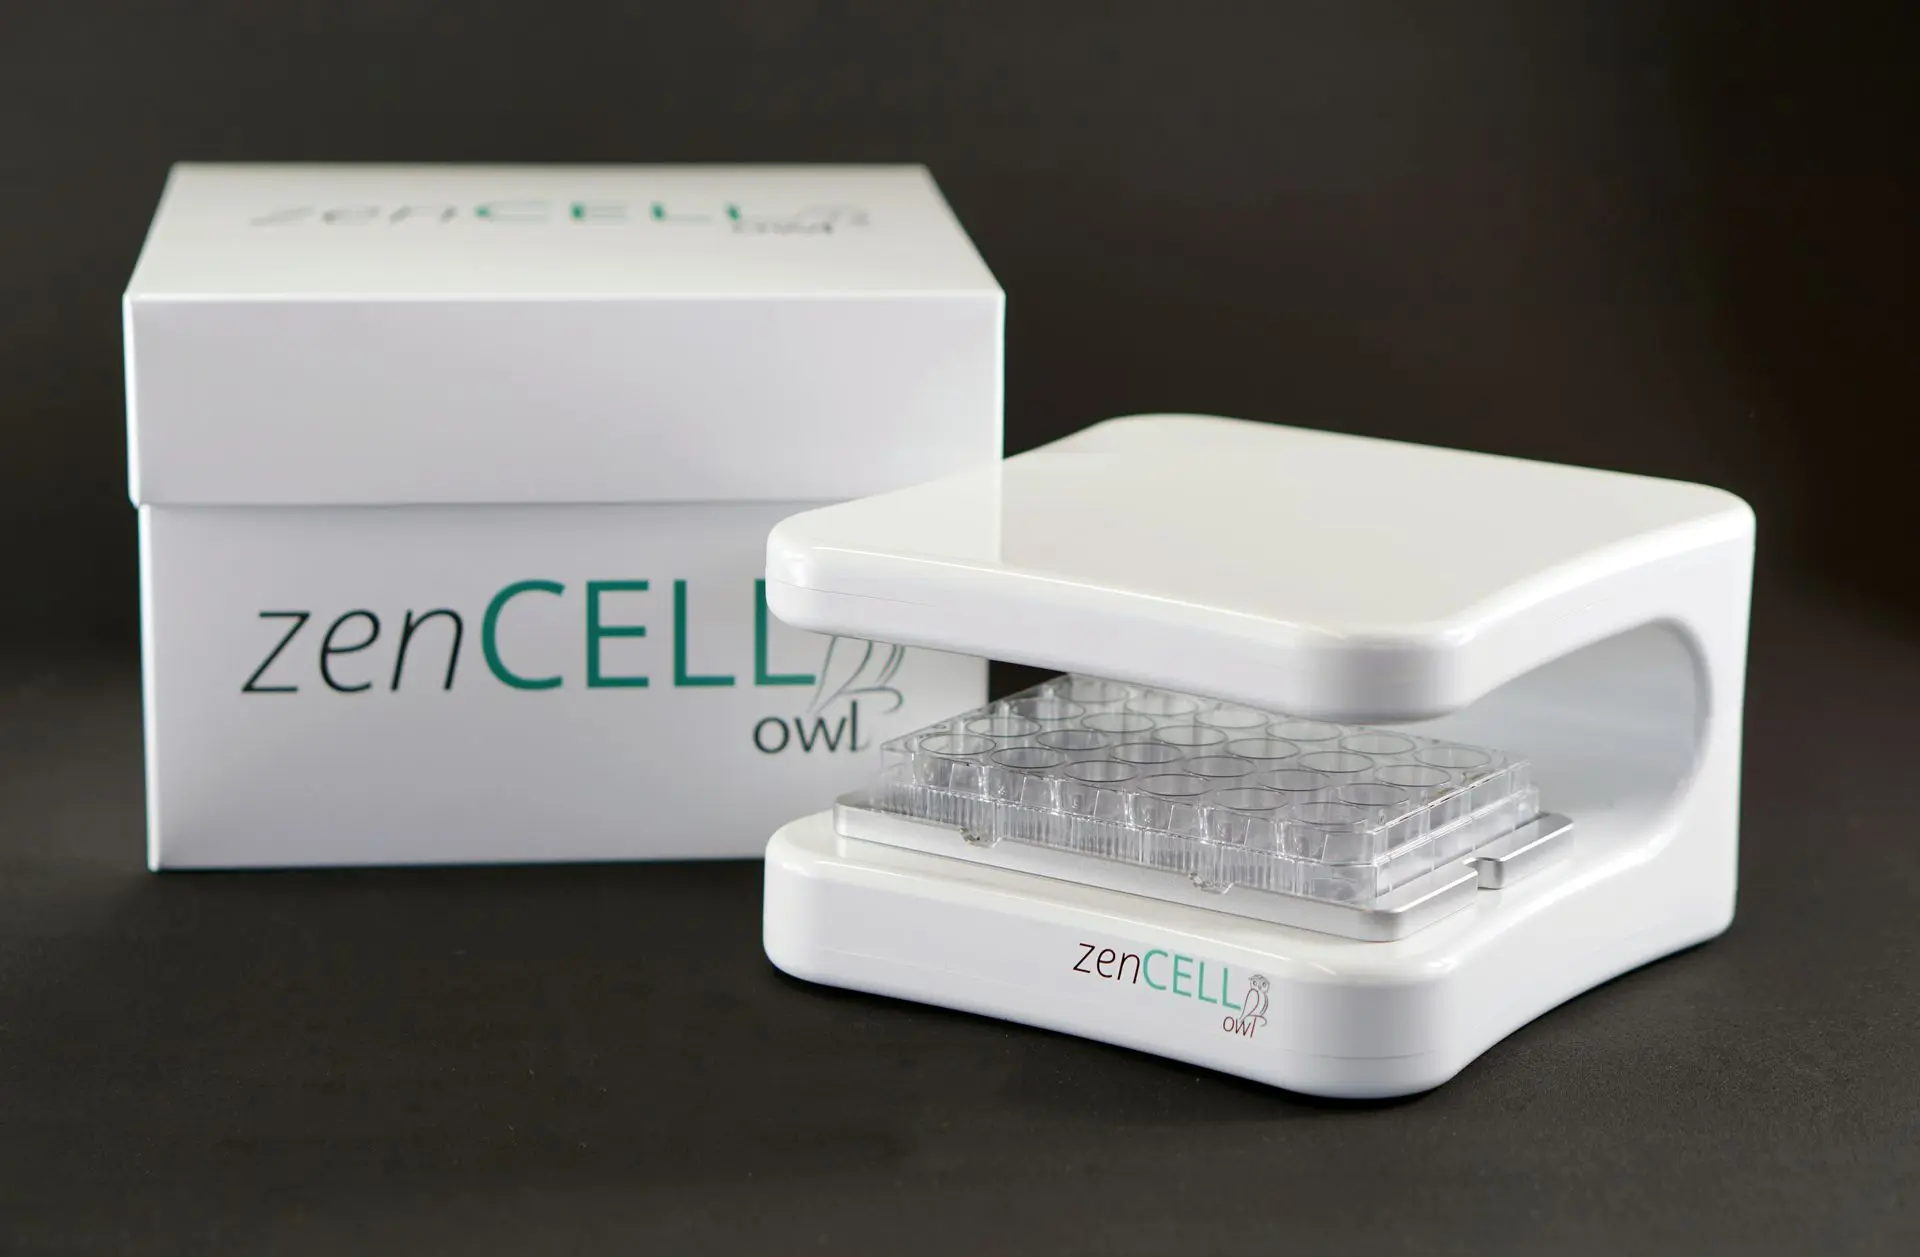
zenCELL owl for your cell culture monitoring
Analyze up to 24 cell cultures simultaneously to raise validity and reproducibility of your experiments. The zenCELL owl uses 24 independent cameras to automatically acquire brightfield scans and image analysis within 5 minutes. Never miss a data point due to real-time continuous monitoring even over long-term measurement periods up to days. Use this fast and efficient device to reach a higher accuracy with lower effort for your experiments.
Automate your cell culture monitoring
Record up to 24 cell cultures in parallel automatically around the clock and in long-term, if desired. Get a higher accuracy and more data with lower efforts.
Watch your cells remotely
Repeated cell culture visits are time consuming and inefficient. Evaluate the current condition of your cell cultures online from outside the lab in your preferred frequency. React and intervene quickly, if necessary.
Ensure stable quality
A consistent cell culture quality requires defined and stable conditions. zenCELL owl allows you to keep cell cultures in the incubator preventing fluctuations of conditions (e.g. temperature, CO₂-supply and humidity) and lowering contamination risk. Defined culture conditions such as hypoxia can be applied!
Perfect start of analysis with perfect cells
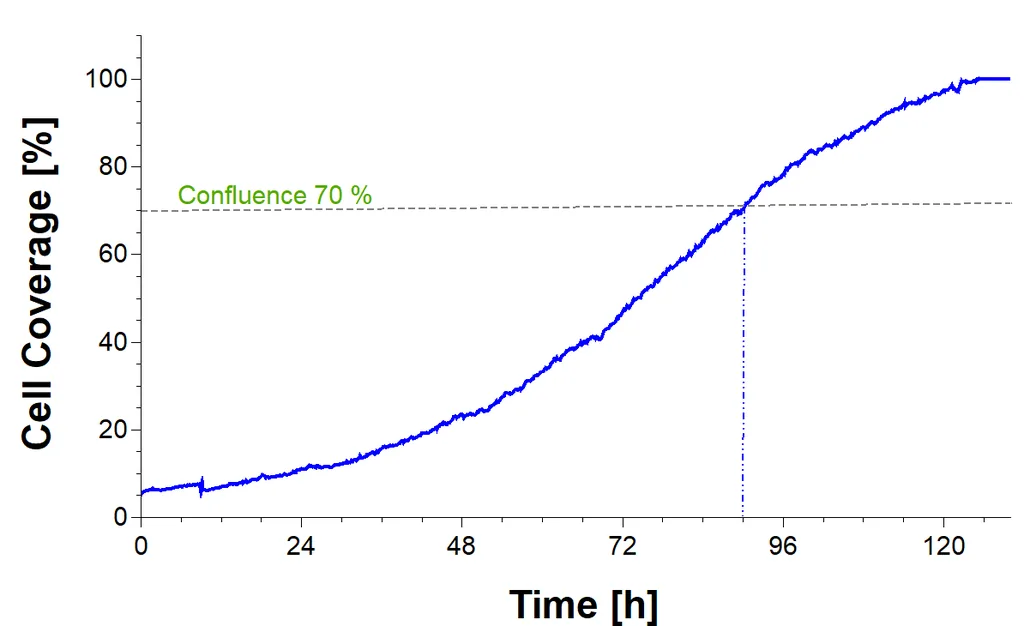
The perfect cell confluence is a critical factor for successful and reproducible cell experiments. Automatic calculation of cell confluence enables you to get more objective and significant information about the confluence status. You can determine the perfect starting point for your experiments without subjective interpretation.
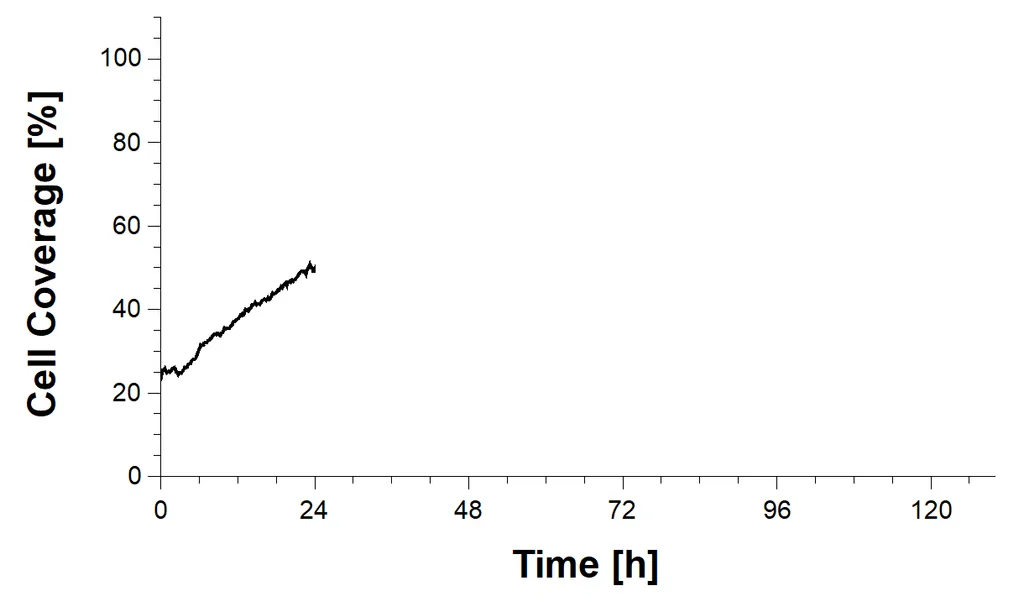
After 24 hours
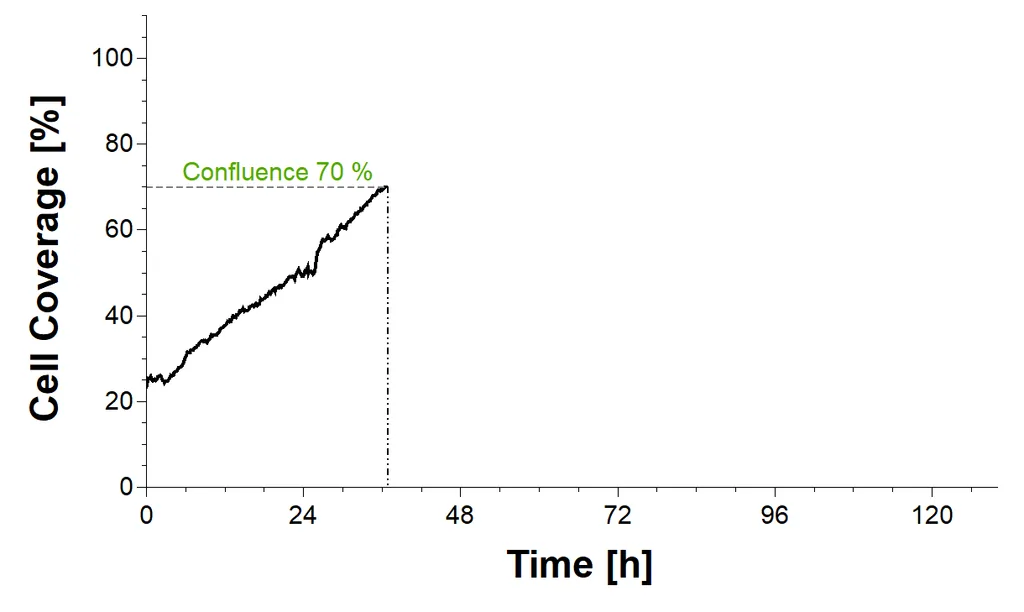
After 36 hours
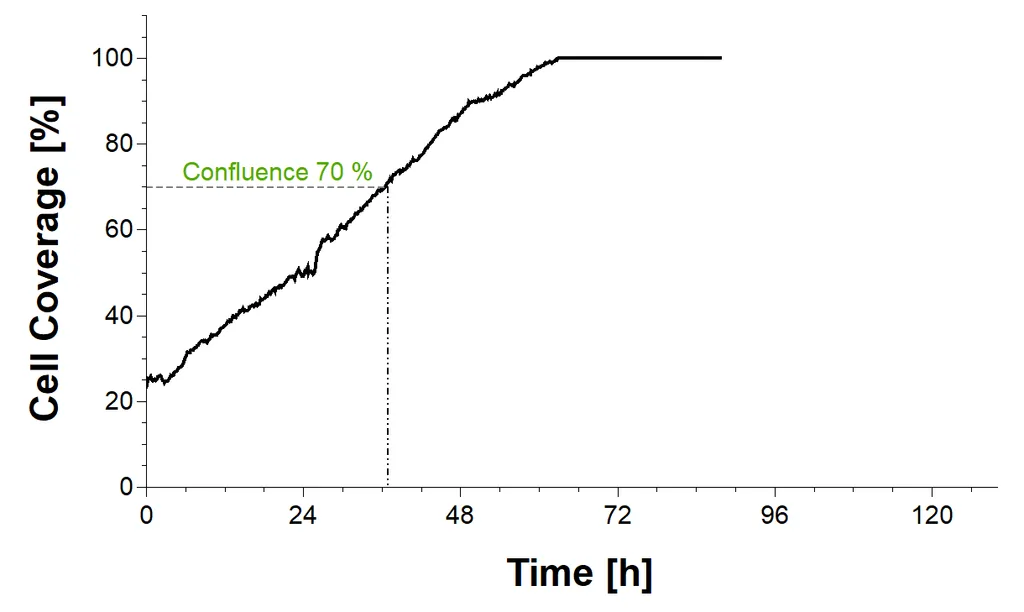
After 90 hours
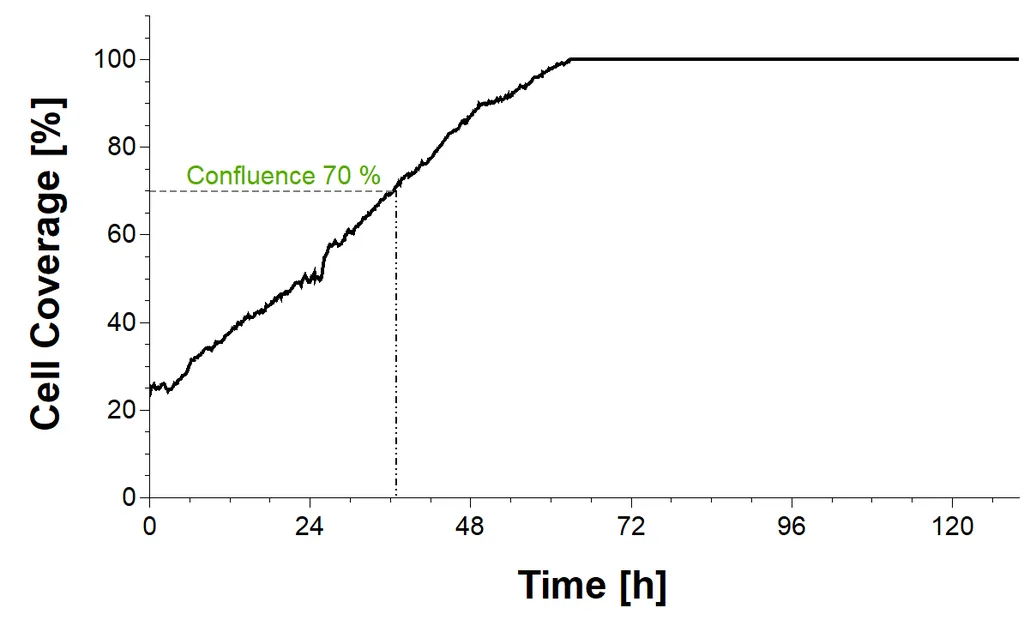
After 120 hours
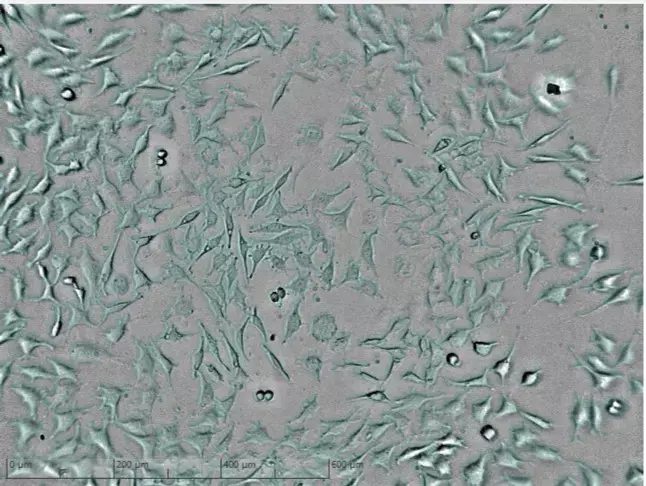
Proliferation phase of cell culture.
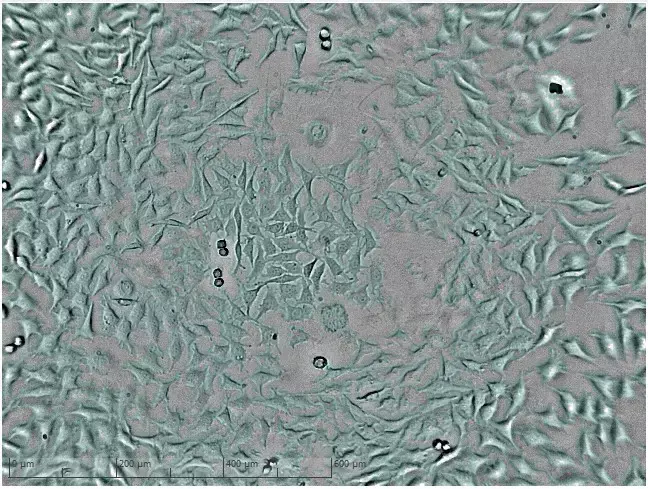
Culture with higher cell count reaches confluence of 70%.
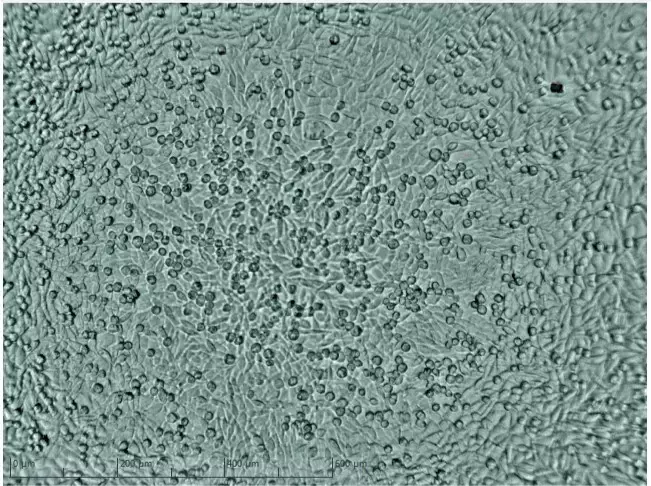
Culture with higher cell count has already reached plateau phase.
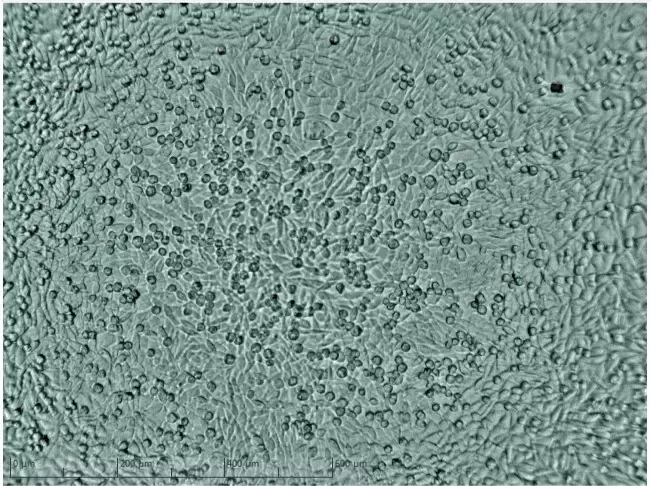
Culture with higher cell count shows confluence of 100%.
Low Cell Count
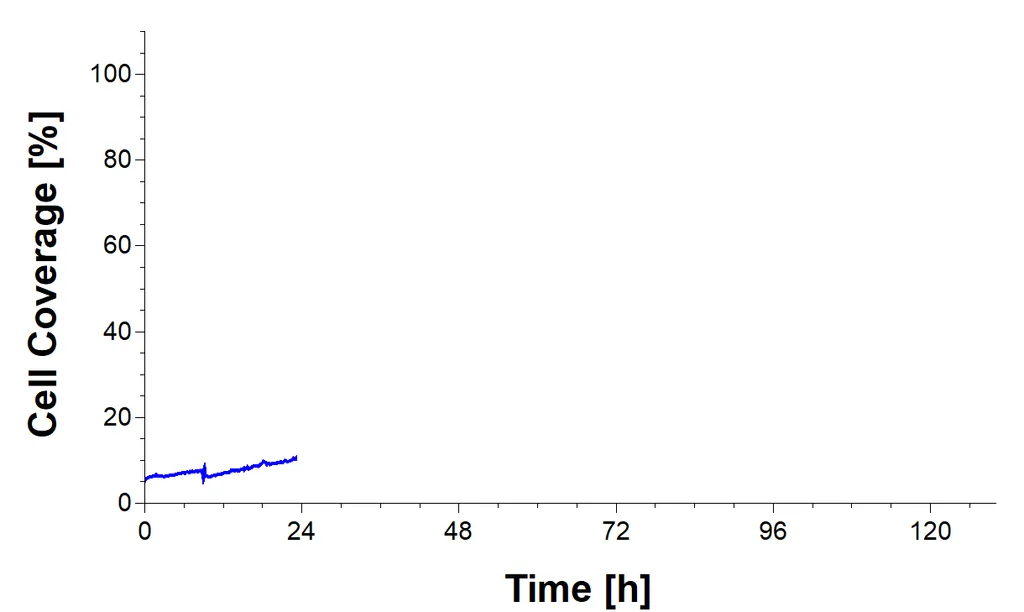
After 24 hours
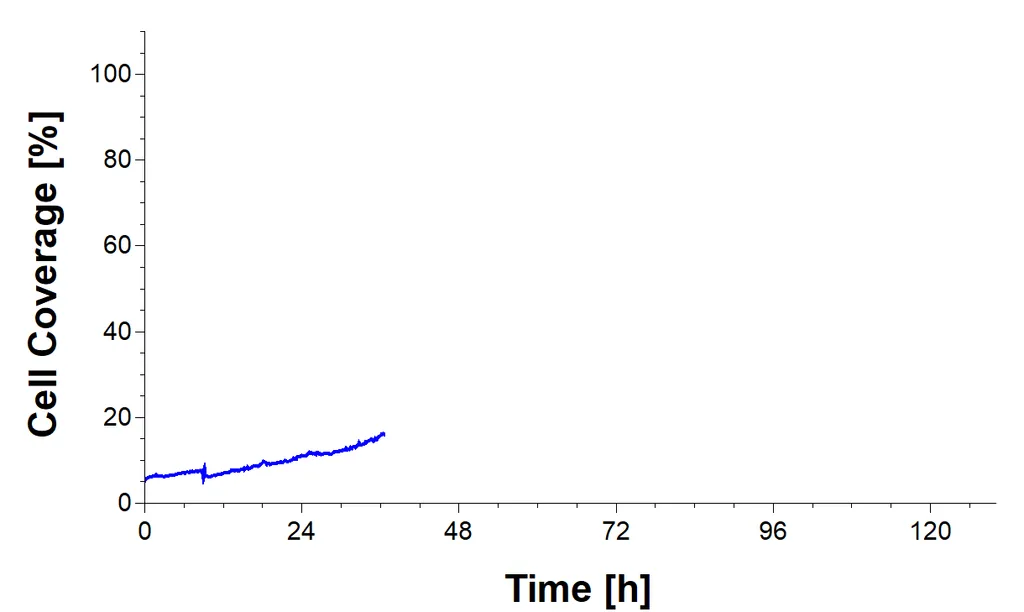
After 36 hours
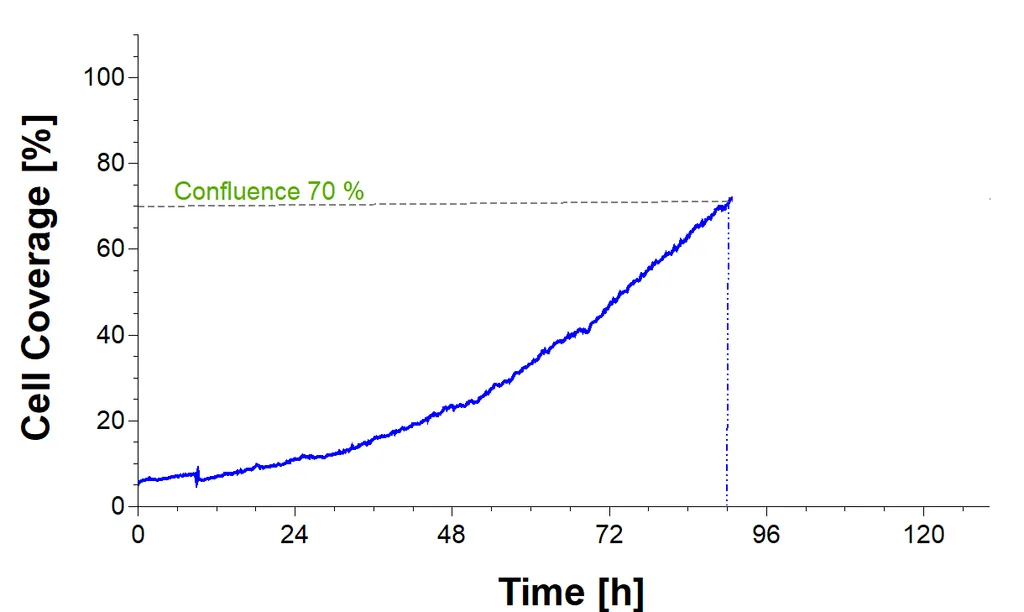
After 90 hours
After 120 hours
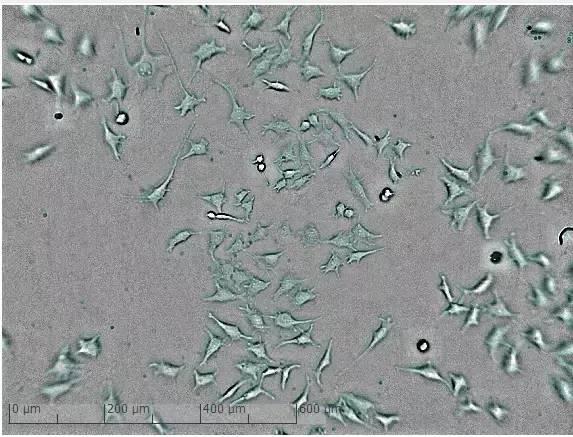
Proliferation phase of cell culture.
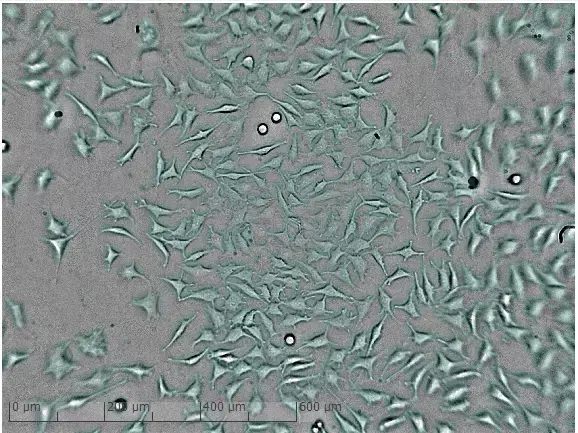
Culture with lower cell count shows confluence of 20%.
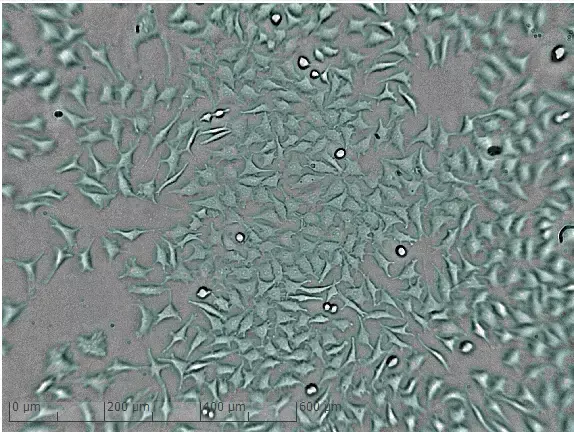
Culture with lower cell count reaches confluence of 70%.
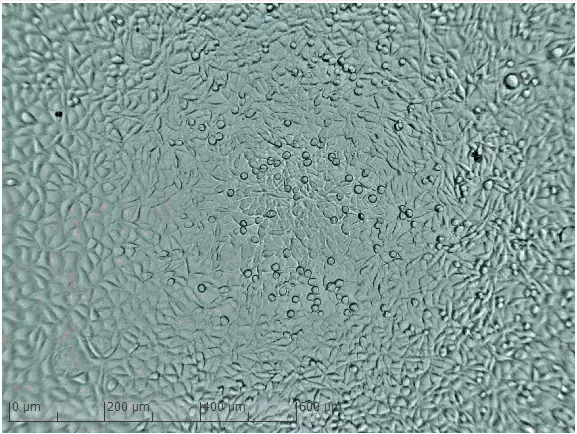
Culture with lower cell count reaches confluence of 100%.
New insights into your cells’ behavior
A higher number of analyzed measurement points allow more precise conclusions about cell cultures.
Analyze dynamic changes and developments of your cell culture retrospectively and in detail. Don’t miss any change in cell morphology by zooming down to single cell level and visualizing a cell while it’s dividing, moving or dying. Analyze the development of the confluence of cell cultures or number of colonies and compare different wells with each other. Use time lapse videos for your documentation.
Watch up to 24 cultures at once, inside your own incubator, without taking them out.