Cellular Impedance Explained:
A Powerful Tool for Real-Time Cell Analysis
Positioned between reductionistic biochemical assays and whole-organism in vivo experimentation, cell-based assays are essential tools in biological research. However, traditional assays have limitations, including the need for labels or dyes, the incompatibility with real-time monitoring, the limited ability to integrate with other analytical techniques and the lack of objective and quantitative readouts.
Cellular impedance assays overcome these
challenges by providing non-invasive, label-free, real-time monitoring of
cell behavior.
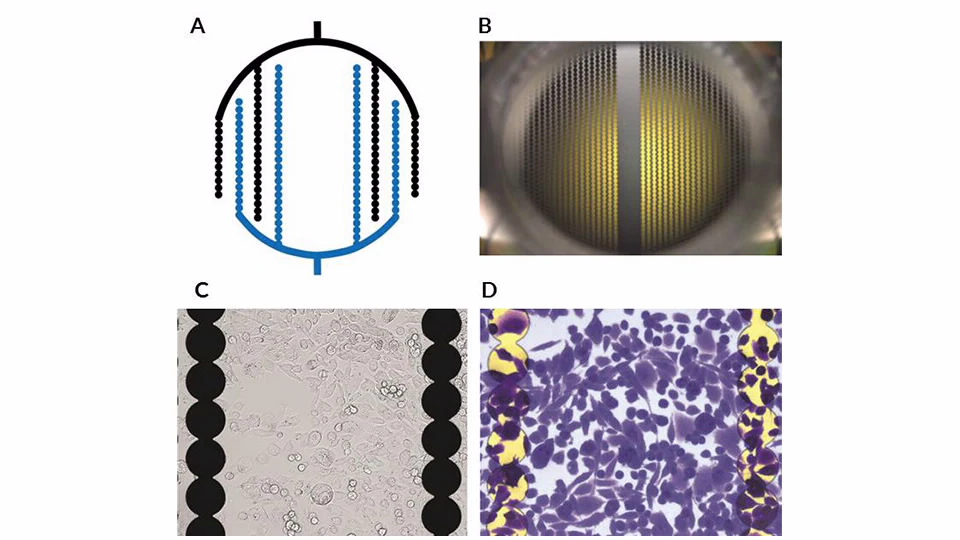
Impedance electrodes on RTCA E-Plates. (A) Schematic of interdigitated electrodes in an E-Plate well (not to scale). The electrode-free center allows for microscopic imaging. (B) Photo of a single well in a 96-well E-Plate. (C) Brightfield image showing shadowed electrodes and unstained human cells. (D) Gold electrodes with crystal violet-stained human cells under a compound microscope.
Functional Unit of a Cellular Impedance Assay
The core technology behind cellular impedance assays are gold microelectrodes embedded at the bottom of electronic microtiter plates (E-Plates). These electrodes cover 70–80% of the well surface (depending if a view area is present), enabling high sensitivity. Electrode arrangement in interdigitating arrays, allows simultaneous monitoring of cell populations. This provides exquisite sensitivity to real-time changes in cell number, size, shape, and attachment quality by detecting impedance variations.
How Cellular Impedance Assays Works
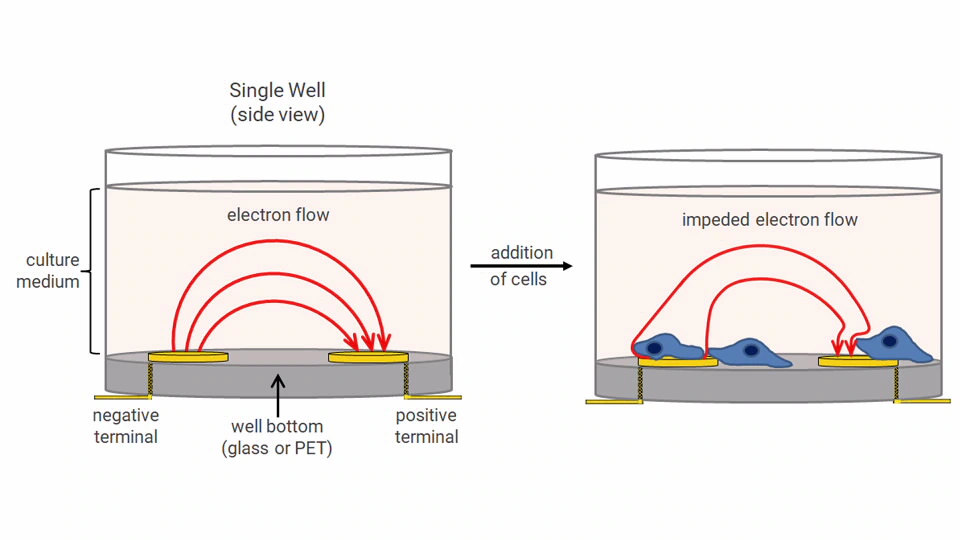
Unlike traditional cell-based assays, xCELLigence RTCA technology provides a continuous, non-invasive assessment of cell health without labels or dyes. The low applied voltage (22 mV) ensures no impact on cell viability or function, making it ideal for long-term kinetic studies.
- Electrode Circuit Formation – When submerged in a conductive solution (e.g., culture media or buffer), a small electric potential (22mV) is applied, allowing electrons to flow through the solution.
- Cell Interaction & Impedance – As adherent cells attach to the electrodes, they impede electron flow, creating a measurable impedance signal.
- Quantitative Readout – The magnitude of impedance is influenced by:
- Cell Number
- Cell Size & Shape
- Attachment Strength
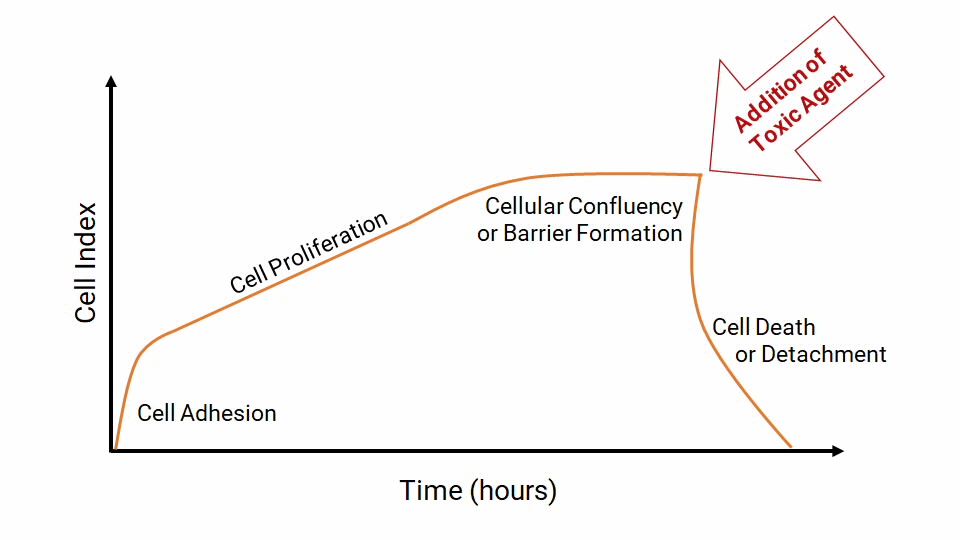
Generic real-time impedance trace for an apoptosis assay, with phase explanations in the text.
Understanding Real-Time Impedance Traces
The impedance of electron flow caused by adherent cells is reported using a unitless parameter called Cell Index (CI), where CI = (impedance at time point n – impedance in the absence of cells)/nominal impedance value.
- Cell Adhesion & Spreading – CI increases after cell addition as cells attach and form focal adhesions.
- Proliferation Phase – CI rises steadily as cells divide and occupy the well surface.
- Confluence Plateau – CI stabilizes when cells reach full confluence.
- Apoptosis & Detachment – CI decreases as apoptotic cells round up and detach.
Beyond apoptosis studies, impedance-based assays can assess cell adhesion dynamics, proliferation kinetics and cytotoxic effects/drug responses without labels or endpoint staining.
Correlating Impedance with Cellular Phenomena
xCELLigence RTCA technology provides a quantitative, real-time readout of key cellular parameters and is widely used across multiple research areas, including:
- Endothelial Barrier Function
- Chemotaxis & Cell Migration
- Filopodia Dynamics
- Immune Cell-Mediated Cytolysis
Despite its broad applications, xCELLigence technology also enables highly specific investigations. By incorporating appropriate controls and orthogonal assays, researchers can correlate impedance traces with specific molecular and biochemical events, enhancing data accuracy.

(A) A549 cell adhesion on collagen IV-pre-coated wells, showing correlation between impedance values (Cell Index) and adherent cell visible in the microscope. (B) HeLa cell response to GPCR agonist dopamine at varying concentrations (black arrow = dopamine addition). (C) NK 92 cell-mediated cytolysis of MCF7 breast cancer cells. (D) A549 cells exposed to drugs with different mechanisms of action.